Decile
The screener
TL;DR
Decile scores roughly 13,000 US ZIP codes on five weighted pillars (price momentum, rental yield, economic growth, supply and demand, and risk), highlights the top 10% for buying, and separately scores which markets suit long-term rentals.
It was built to hold up under questioning. Every number traces back to a named source and date, figures estimated from county data are labeled as estimates, and no rent number ever appears without a range and a confidence grade.
Fun Fact
The name comes from the output. There are about 39,000 US ZIP codes, roughly 13,000 to 18,000 of which have enough data to rank at all, and the list that matters is the top tenth of those.
ZIP codes aren't really areas on a map. They're mail delivery routes, and the Census doesn't use them, so most useful statistics have to be translated across a lookup table before they can be compared.
The question it answers
If you were going to buy a rental property somewhere in the United States and had no particular reason to prefer one town over another, where would you look first? Every consumer tool I found answered a narrower question, like what a specific house is worth. The ones that did answer the broad question gave a single score with no way to see how it was calculated.
Decile ranks every ZIP code in the country on a five-pillar composite index. My main design goal was that I should be able to defend any number on the screen in front of people whose job is to poke holes in it.
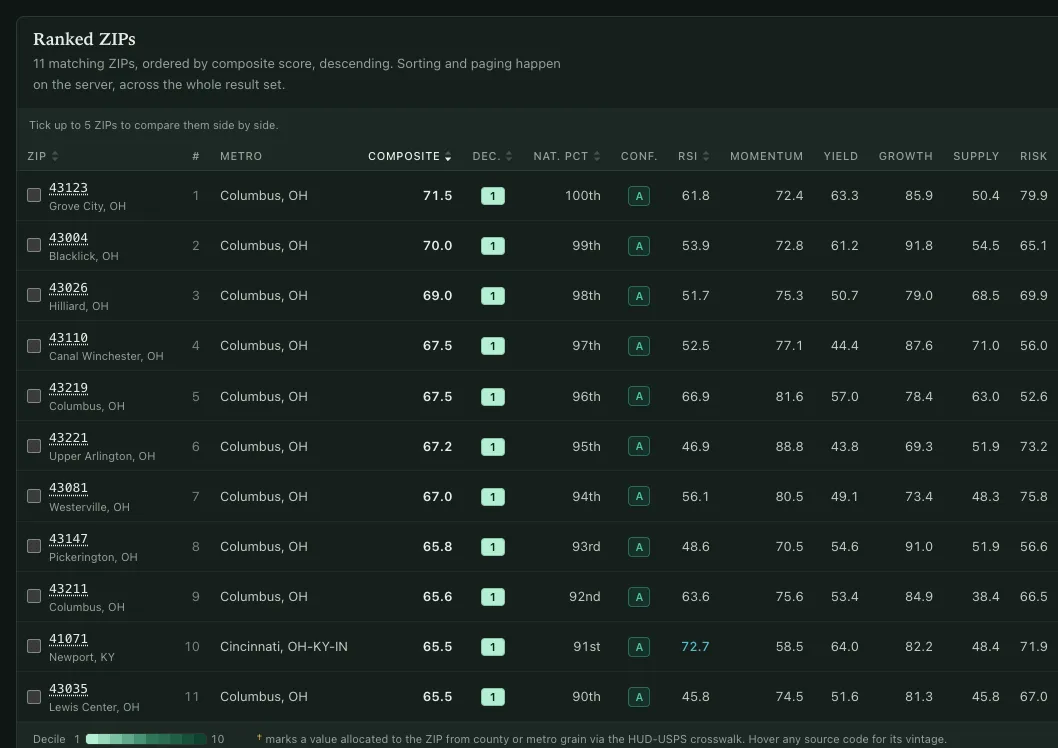
Five pillars
| Pillar | Key indicators |
|---|---|
| Price momentum & value | 1-year and 5-year home price momentum, 10-year growth rate, a penalty for prices running well above their long-term trend |
| Rental yield & cash flow | Gross yield, 3-year rent growth, rent compared to HUD fair market rent, rent-to-income headroom |
| Economic & demographic growth | Population and income growth, employment and wages, net migration weighted by income |
| Supply & demand balance | Inventory and days-on-market trend, vacancy, building permits compared to household growth |
| Risk & stability | Largest price drop, volatility, reliance on a few big employers, tax burden, how landlord-friendly local rules are |
Each indicator has its extreme values trimmed, gets ranked against every other ZIP, and is weighted within its pillar. The pillars are then weighted into a 0–100 composite score and a decile. There are two weighting profiles, Balanced and Cash-flow, because "best market" means something different depending on whether you're buying for appreciation or for rent.
If one indicator is missing, its weight is spread across the rest of its pillar. If a whole pillar is missing, the ZIP's confidence grade is capped and it's left out of the main list, so a partly scored market never ranks against fully scored ones.
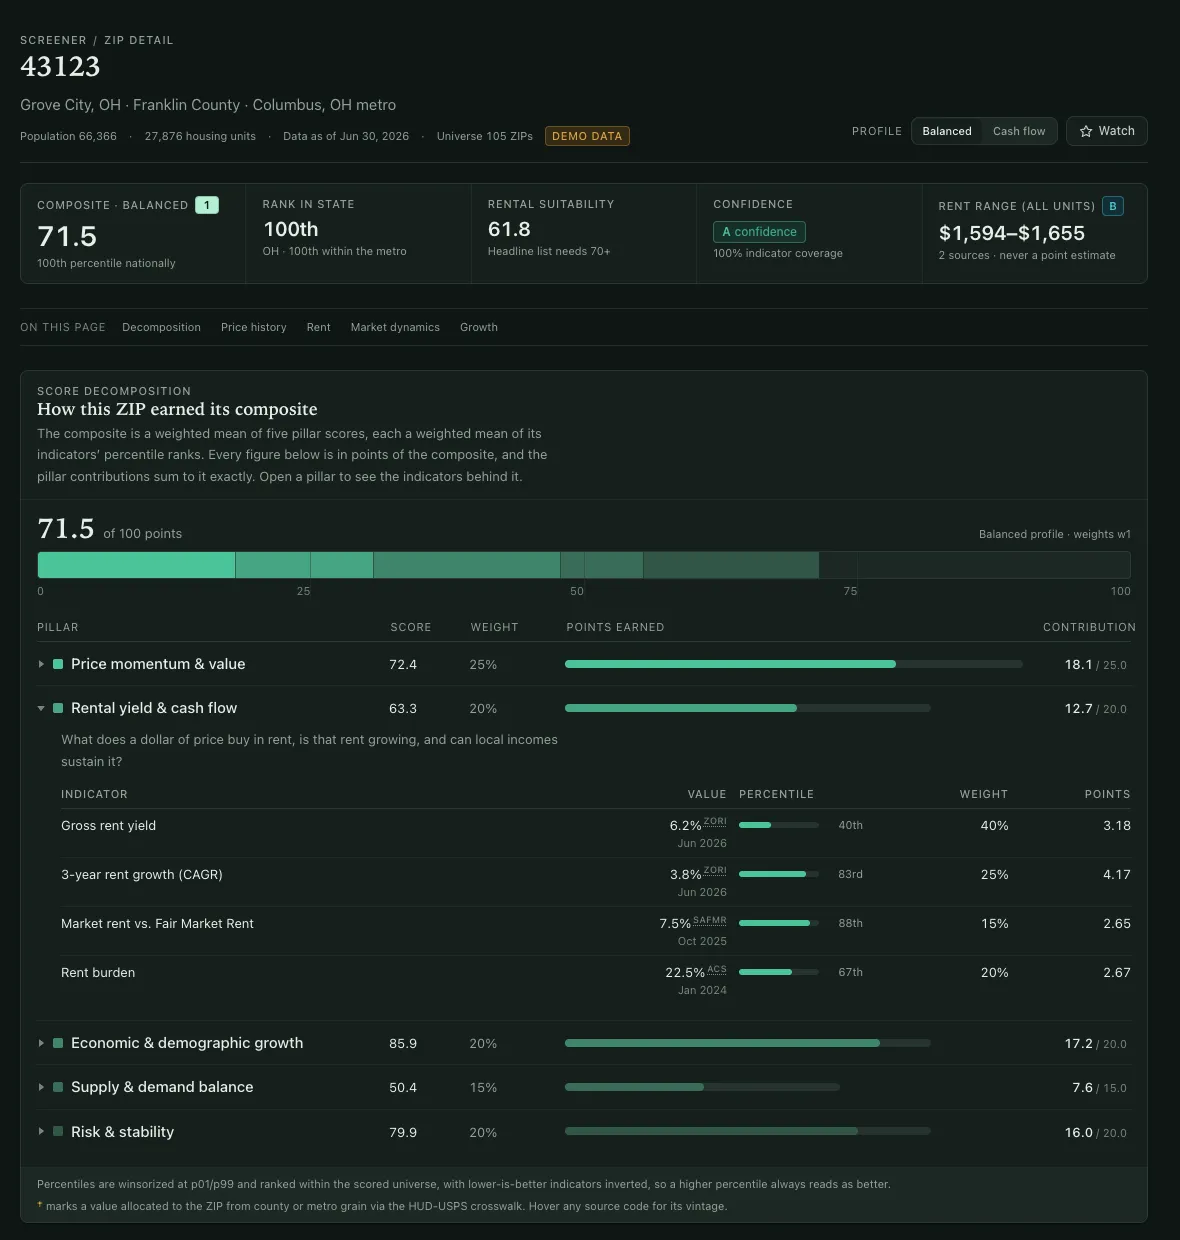
Alongside the composite is a separate Rental Suitability Index, and the main rentals list only includes ZIPs in the top decile and with a suitability score of 70 or higher.
The geography problem
This turned out to be the hardest part of the project, and none of it shows on the finished screen.
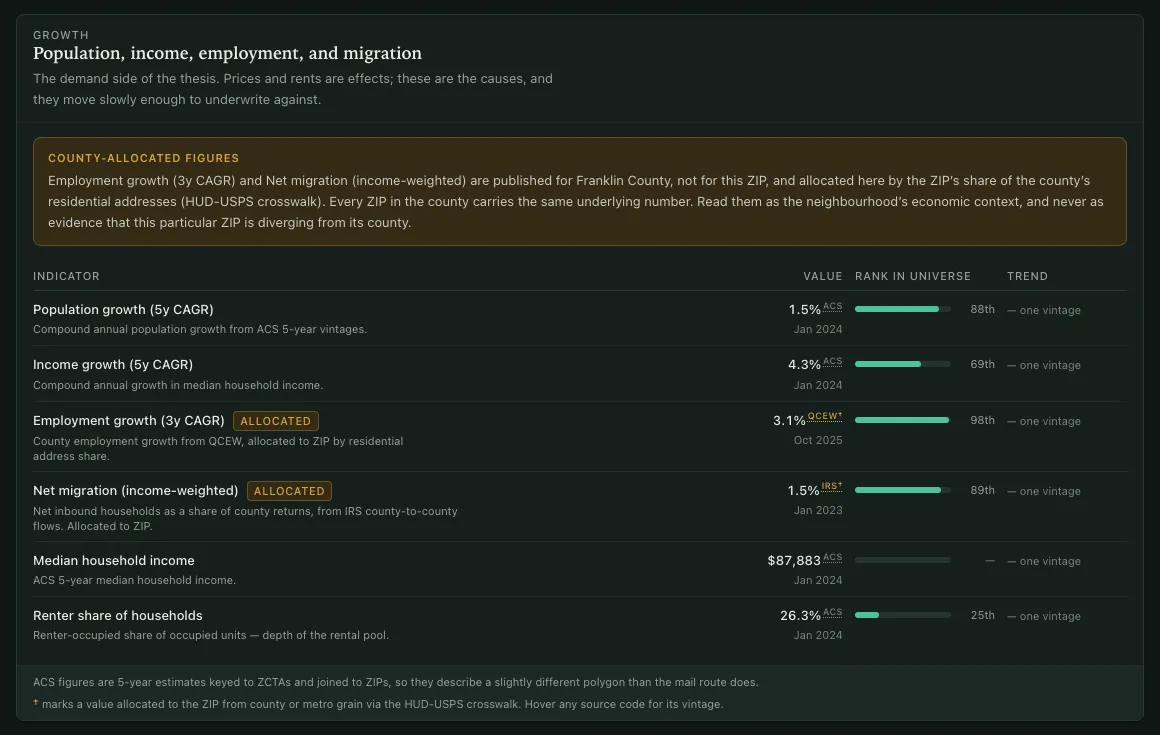
ZIP codes are US Postal Service delivery routes. They aren't clean shapes on a map, they don't fit neatly inside counties, and the Census Bureau doesn't use them. The Census publishes data for ZCTAs, which are approximations of ZIP codes built from census blocks. So every demographic figure has to be matched through a ZIP-to-ZCTA lookup before it can sit next to a housing figure.
On top of that, several of the most useful indicators (building permits, employment, migration, and crime) are only published by county. Those get divided down to the ZIP level using HUD's quarterly crosswalk tables, matching the version of the table to the time period of the data instead of just using the newest one.
Any number estimated that way is labeled as an estimate everywhere it appears in the interface. A county-based employment number is still useful, just less precise, and anyone reading it should be able to tell which kind they're looking at.
Never a rent number on its own
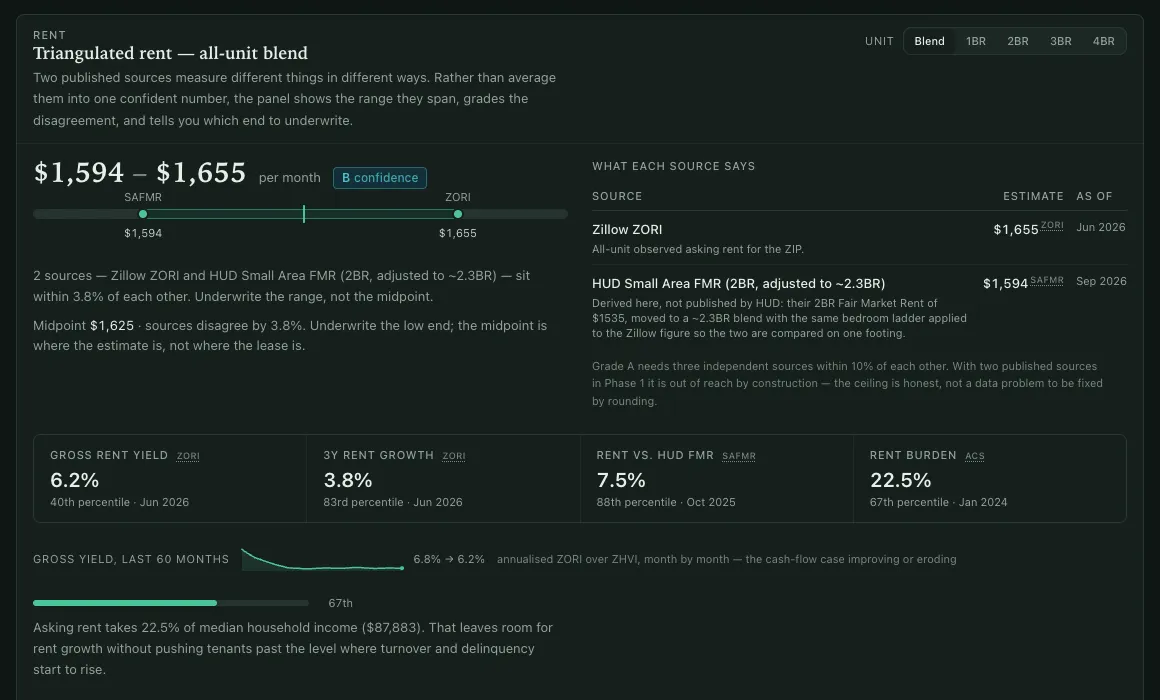
This is the rule the product is built around, and the one that started it.
Rent is the number every real estate calculator gets confidently wrong. It shows a single estimate as if it were a measurement, when it's really a guess based on limited, outdated data. Decile compares rent across several independent sources, shows the gap between them as a range, and gives an A-through-D confidence grade wherever a rent figure appears. An A means three sources agree within 10% and the data is recent. A D means you should call a local property manager.
The deal math works the same way. Assumptions for vacancy, maintenance and repairs, and management fees start on the cautious side, and the stress-tested version appears right next to the normal one instead of behind a toggle, so the optimistic number never appears alone.
Built to be checked
A few design decisions came from treating "defensible" as a hard requirement:
- Every fact is stored the same way. Each one is a row of
(zip, indicator, period, value, source, allocated). Adding a new data source never changes the database structure, and every value carries where it came from. - The methodology page is generated from the same settings the scoring uses. There's only one definition of the weights, so the explanation can't fall out of sync with the math.
- Scores can be reproduced. A score depends only on the data versions, the weight version, and the code version, and all three are recorded with each run. Monthly snapshots never change after they're saved, which is what makes it possible to backtest the rankings.
- No scraping. It uses published datasets and licensed APIs only, with sources credited on every export.
It works without a database
One decision I'd repeat on every project: with no database connected, the app loads a set of sample data instead of showing an error. Every page loads, the screener filters work, and the ZIP detail pages draw their charts. You can see the whole product before loading any real data.
The first phase also runs entirely on free data: federal housing price indexes, the Census, labor statistics, IRS migration data, HUD fair market rents, and public real estate research datasets. I put off paid data sources behind a written go/no-go checklist, because the fastest way to kill a personal project is to make it cost money before it has proven it's worth any.