Swing Desk
TL;DR
Swing Desk pulls three years of daily price data for roughly 1,700 liquid US stocks into a local SQLite database, calculates a full set of indicators, checks every day for five classic swing setups, and ranks every stock with a 0–100 composite score.
Then it tries to prove itself wrong. A walk-forward backtester and three separate validation rounds test whether any of that ranking pays off, and so far the answer is that it doesn't.
Fun Fact
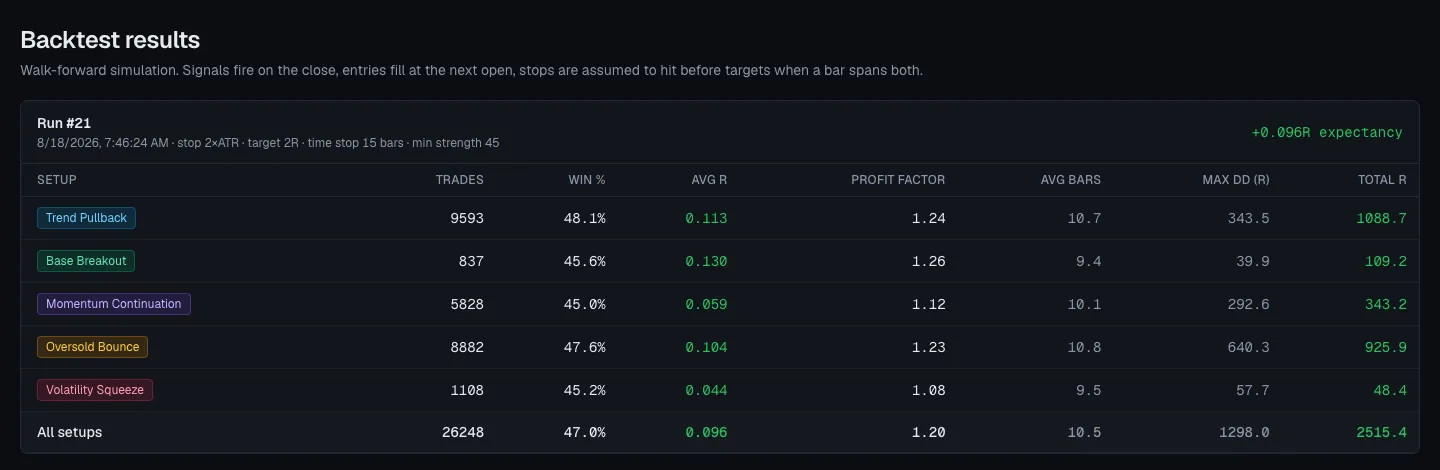
The most important measurement came back negative. Across 26,248 simulated trades, picking a fixed number of stocks from the setup candidates did no better than picking them at random from the whole universe.
Every data source is free and needs no key: Yahoo Finance for prices and the Nasdaq Trader symbol directory for the list of stocks. No subscriptions, no API keys, and nothing leaves the machine.
What it is
Swing Desk is a research tool for swing trades in US stocks, the kind you hold for a few days to a few weeks. It runs on my laptop with Next.js for the interface and SQLite for storage. There's no login, no cloud, and no account with anybody. The database is a single file, and if I delete it, the whole thing rebuilds from public data in under an hour.
The pipeline is three commands:
ingestbuilds the list of tradable stocks from the free Nasdaq Trader symbol directory (liquid US common stocks, filtered on price, average volume, and market cap), then pulls three years of daily prices for each one, adjusted for splits and dividends.computeruns the indicators, the setup detectors, and the scoring across every stock and every trading day.backtestreplays history and tells me whether any of it was worth doing.
The setups
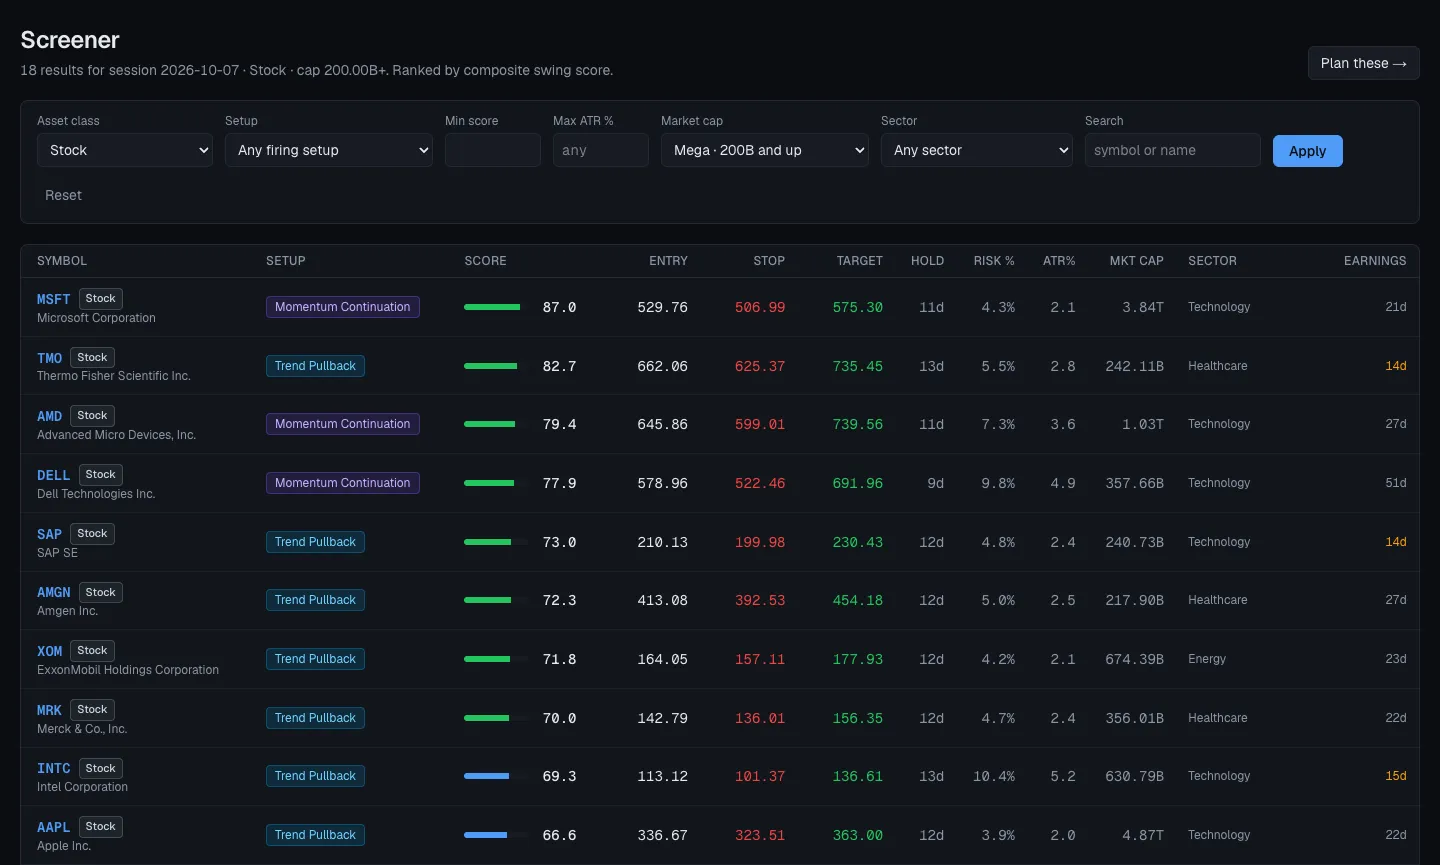
It looks for five classic patterns every day. Each one returns a strength score and a plain-English list of reasons:
| Setup | Idea | Typical hold |
|---|---|---|
| Trend Pullback | Dip to the 10/20 EMA inside an uptrend, turning back up | 5–15 days |
| Base Breakout | Tight base clearing the 20-day high on volume | 5–15 days |
| Momentum Continuation | Relative-strength leader near 52-week highs, ADX rising | 10–20 days |
| Oversold Bounce | RSI(2) washout above the 200-day | 2–6 days |
| Volatility Squeeze | Bollinger-in-Keltner compression releasing upward | 5–10 days |
On top of those is a 0–100 composite score that weighs trend, relative strength, momentum, setup quality, liquidity, and risk, and ranks every stock each day.
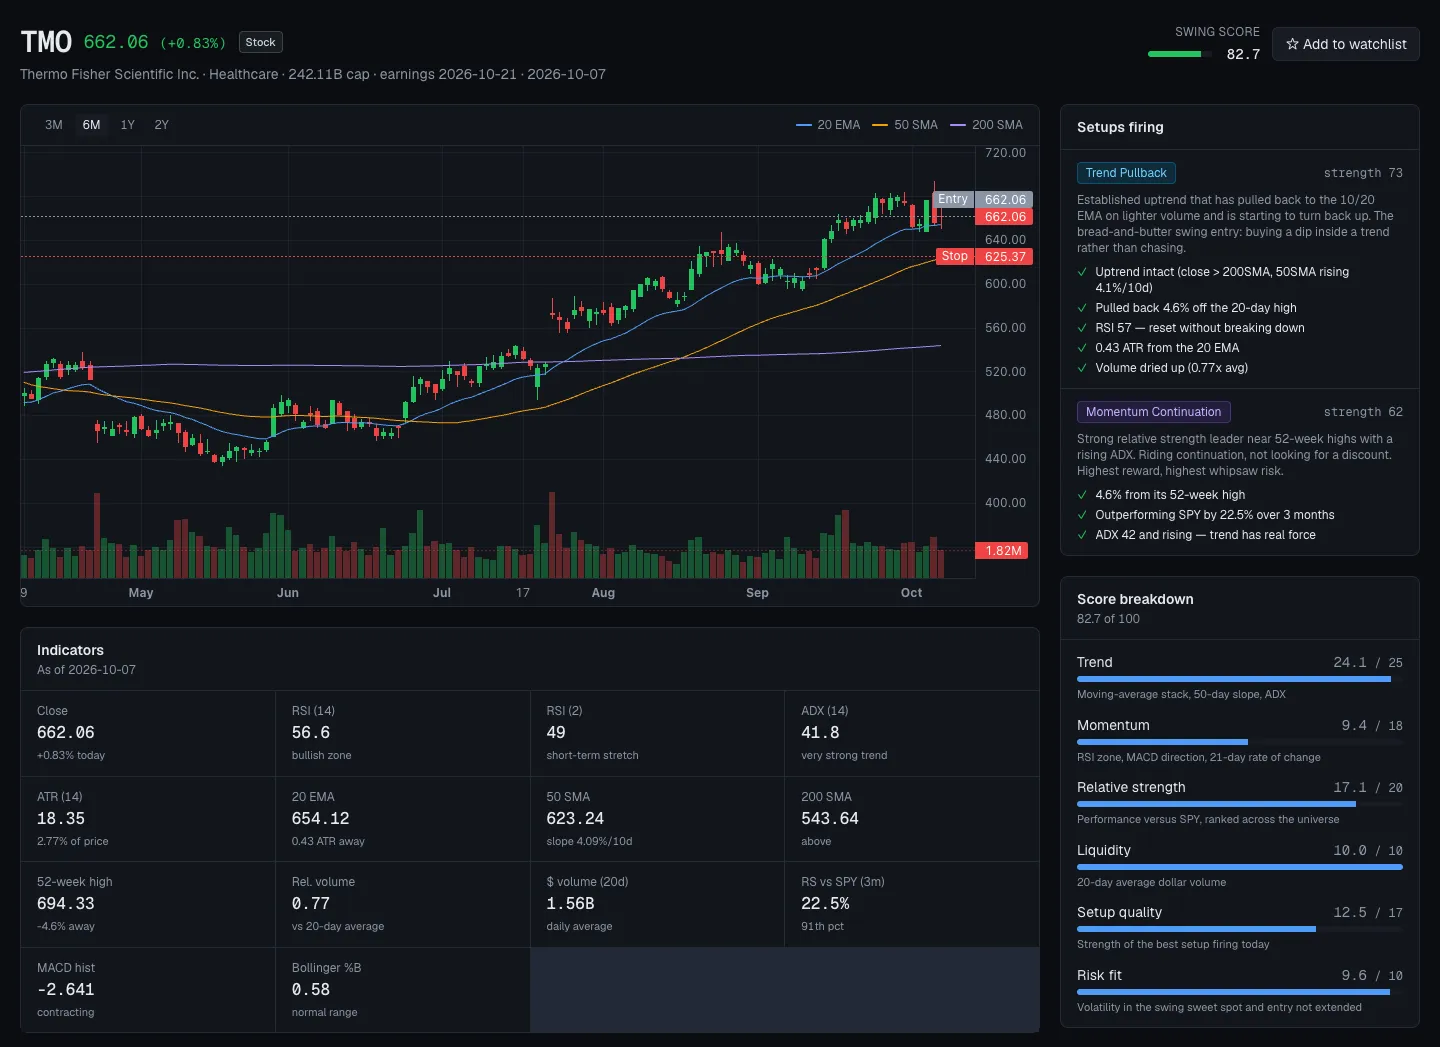
Each candidate gets a trade plan on its own page: an entry, a stop at two times the average true range, a target at twice the risk, and a position size worked out from the percentage of the account you're willing to risk.
Making the backtest hard to fool
A backtester that makes you look good is worse than no backtester, and most of the ways they do it are mechanical rather than statistical. So the engine takes the pessimistic option every time something is ambiguous:
- A signal calculated on one day can only be traded at the next day's open. Nothing can act on information it wouldn't have had yet.
- If the price gaps past a stop, the trade fills at the opening price instead of the stop price.
- If a day touches both the stop and the target, it assumes the stop hit first.
- Slippage is charged on both the entry and the exit.
- Only one position per stock at a time.
It reports win rate, expectancy, profit factor, and maximum drawdown for each setup separately, so a good overall number can't hide a bad setup.
Three rounds of bad news
Three separate validation rounds are written up in the repository. All three came back negative, and I kept them.
The first tested whether the composite score's weighting could be improved. Four ideas were tested and all four were rejected. Nothing changed, and the write-up now exists so the next person who looks at those weights knows which obvious improvements have already been tried.
The second tested selection. Given the candidates that showed up on a given day, does any method beat "take the top few by score"? Four methods were tested, and all four were rejected.
The third asked the question the first two had been circling. If the setups don't help on a per-trade basis, maybe they help by being selective, keeping your money out of the market until something good comes along. That was testable too, and it didn't hold up. At every account size a real person could run, the money was fully invested 100% of the time in every version, so nothing was being saved by waiting, and the comparison fell right back to the per-trade results the setups had already lost.
The short version, from the write-up itself:
The desk's measured edge lives in its exit rules and in this bull market, not in its entries. Filling a fixed number of slots from the setup candidates is indistinguishable from filling them by throwing darts at the whole universe, and the composite score adds nothing on top of the setup filter.
That wasn't the result I was hoping for when I started building setup detectors. It's also the most useful thing the project has produced, and I only got it because the backtester was built to be able to say no.
Limitations
The repository lists these, and this page should too. Yahoo's API is unofficial, and a change on their end could break the data download without warning. The backtest only includes companies that still exist today, which makes every result look better than it would have been in real time, so the numbers are useful for comparing setups against each other, not for predicting returns. It only uses daily prices. And the bull market during the test period is helping every number.
None of this is investment advice. It's a research tool that happens to be pointed at the stock market.